Cómo ahorrar 5.000 € por contenedor con planificación 3D
La utilización media del sector se sitúa entre el 75 y el 85 %. Un algoritmo FFD de empaquetado en contenedor la eleva al 94 %+. Esa mejora del 9 % supone un ahorro de 2.000 a 5.000 € por contenedor. Aquí están los cálculos, el algoritmo y un caso real de ahorro de 4.200 €.
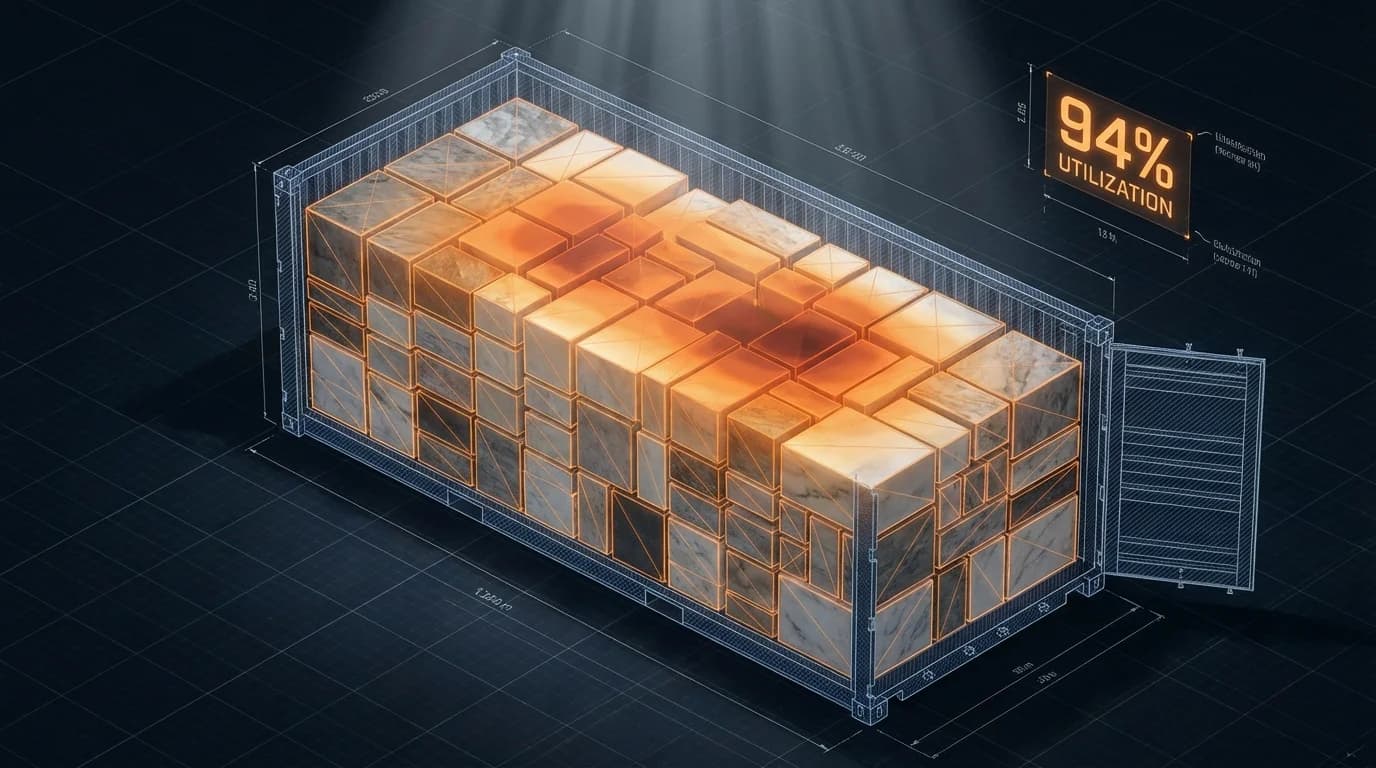
El 18 % de su contenedor es aire
Está usted en el puerto de El Pireo. Un contenedor de 40 pies reposa sobre el chasis, cargado con 42 bloques de mármol Thassos White con destino a un distribuidor en Nueva Jersey. El capataz firma. El contenedor se precinta.
En su interior, el 18 % del espacio es aire. Acaba de pagar por enviar nada.
Con un valor medio de la mercancía de 50.000 € por contenedor, ese 18 % representa 9.000 € de capacidad desperdiciada. Multiplíquelo por 10 contenedores al mes y estará ante 90.000 € al año en espacio que pagó pero no aprovechó.
Por qué falla la carga manual
El método estándar de carga de contenedores no ha cambiado en décadas. Un capataz experimentado inspecciona los bloques, estima las dimensiones a ojo y dirige al equipo de carga. Las piezas más pesadas, primero, a lo largo del suelo. Los bloques más ligeros, encima. Separadores de madera rellenan los huecos.
Este proceso depende de la intuición espacial desarrollada a lo largo de años. Es trabajo cualificado, no negligencia. Pero tiene limitaciones inherentes:
Formas irregulares. Los bloques de piedra natural no son rectángulos uniformes. Tienen bordes irregulares, perfiles en forma de cuña y variaciones dimensionales. Un operario humano no puede optimizar simultáneamente decenas de geometrías irregulares en un espacio confinado.
Presión de tiempo. La carga de contenedores opera bajo plazos estrictos. El camión espera. El buque tiene un límite de admisión. No hay tiempo para probar 15 distribuciones distintas.
Sin algoritmo de optimización. El cerebro humano es bueno en razonamiento espacial, pero no puede evaluar 1.200 configuraciones posibles en cuatro segundos. Se conforma con lo «suficientemente bueno» en lugar de optimizar. Lo suficientemente bueno equivale a una utilización del 75-85 %.
Los cálculos que deberían preocuparle
Un contenedor de 40 pies cargado con mármol de primera calidad a 1.500 € por metro cúbico tiene un valor de mercancía de entre 36.000 y 67.500 €. La media del sector es de aproximadamente 50.000 € por contenedor.
| Utilización | Valor desperdiciado/contenedor | A 10/mes | A 50/mes |
|---|---|---|---|
| 75 % | 12.500 € | 125.000 €/año | 625.000 €/año |
| 85 % | 7.500 € | 75.000 €/año | 375.000 €/año |
| 94 % (FFD) | 3.000 € | 30.000 €/año | 150.000 €/año |
La diferencia entre el 85 % y el 94 % es de 4.500 € por contenedor. Eso supone un ahorro de 2.000 a 5.000 € en cada envío.
Cómo funciona el algoritmo FFD de empaquetado en contenedor
FFD son las siglas de First Fit Decreasing (primer ajuste decreciente). Es un algoritmo ampliamente estudiado en geometría computacional:
Paso 1: Ordenar. Todos los bloques se ordenan por volumen de forma decreciente. El bloque más grande va primero.
Paso 2: Colocar. El algoritmo sitúa el bloque más grande en la posición óptima, considerando todas las orientaciones posibles. No evalúa solo si el bloque cabe, sino dónde encaja mejor, minimizando el espacio irregular restante.
Paso 3: Repetir. El siguiente bloque en tamaño se coloca en la mejor posición disponible. El algoritmo recalcula el espacio disponible tras cada colocación, teniendo en cuenta la geometría tridimensional de todos los bloques ya situados.
Paso 4: Validar. Tras cada colocación, se ejecutan tres comprobaciones:
- Distribución del peso: el centro de gravedad se recalcula. Si se desplaza fuera de los límites aceptables, la colocación se ajusta.
- Límites de carga por eje: los pesos de los ejes delantero y trasero deben cumplir los requisitos del Código CTU.
- Detección de colisiones: cada colocación se comprueba frente a todas las posiciones existentes.
Todo el proceso se completa en menos de cuatro segundos para un contenedor de 40 pies completo.
La historia de los 4.200 €
Una cantera europea enviaba 42 bloques de Thassos White a Nueva Jersey. El equipo del almacén cargó de forma manual: 82 % de utilización. Por encima de la media. El capataz estaba satisfecho.
Antes del precintado, el responsable de logística procesó el mismo envío a través de un planificador de carga 3D. El algoritmo FFD evaluó los 42 bloques -- cada uno con sus dimensiones específicas e irregulares capturadas mediante escaneado LiDAR -- y generó una distribución alternativa.
Resultado: 94 % de utilización. Los mismos 42 bloques. El mismo contenedor. Pero reordenados de manera que tres bloques adicionales de un pedido pendiente encajaban en el espacio restante. Esos tres bloques habrían requerido su propio envío parcial la semana siguiente.
Ahorro en ese único contenedor: 4.200 €. El valor de la mercancía de tres bloques adicionales, menos el coste incremental de peso, menos el envío parcial que ya no fue necesario.
Cumplimiento del VGM: el coste oculto en tiempo
El convenio SOLAS exige que cada contenedor cargado disponga de una declaración de Masa Bruta Verificada antes de embarcar en un buque. El proceso manual -- pesar bloques, registrar pesos, calcular totales, formatear documentos -- lleva de 1,5 a 2 horas por contenedor.
Con un planificador de carga 3D integrado, la generación del VGM es automática. El peso de cada bloque ya está en el sistema a partir del escaneado LiDAR y el cálculo de densidad. El documento se genera en menos de 10 segundos. Dos horas de trabajo cualificado, reemplazadas por un clic.
Cumplimiento del Código CTU: automatizado
El Código de Prácticas para el Embalaje de Unidades de Transporte de Carga establece los requisitos para una carga segura: distribución del peso, métodos de sujeción y estabilidad de la carga. El planificador 3D los valida automáticamente:
- Centro de gravedad dentro de los límites aceptables
- Distribución del peso de adelante a atrás dentro de los límites de carga por eje
- Altura de la carga dentro de las dimensiones del contenedor
- Puntos de sujeción identificados para relleno y refuerzo
Cada plan de carga genera un informe de cumplimiento listo para imprimir: posiciones de los bloques, mapa de distribución de peso, diagrama del centro de gravedad y resumen de carga por eje.
El efecto compuesto
| Volumen | Ahorro/contenedor | Impacto anual |
|---|---|---|
| 10/mes | 4.200 € | 504.000 €/año |
| 25/mes | 4.200 € | 1.260.000 €/año |
| 50/mes | 4.200 € | 2.520.000 €/año |
El capataz sigue supervisando cada carga. El equipo sigue realizando el trabajo físico. Pero el plan del que parten ya no está limitado por lo que una persona puede calcular bajo presión de tiempo. Solo lo limitan la física y las dimensiones del contenedor.
La física no deja el 18 % vacío.